
โšก GDB/MI2 Protocol ๐Ÿ–ฅ๏ธ x86 (32-bit) & x86_64 (64-bit) Assembly ๐Ÿงฎ GPR โ€ข EFLAGS โ€ข SIMD (SSE / AVX / AVX-512) ๐ŸŽจ Midnight Aurora Dark Theme

Debug Assembly Visually with PyEzGDB

PyEzGDB (pyezgdb) is a modern Python/Tkinter graphical interface and GDB control library that automatically assembles your 32-bit or 64-bit x86 NASM (.asm) or GAS (.s) source files, executes your code instruction by instruction, and lets you inspect registers, status flags, SIMD vectors, memory sections, and the stack in real time on Linux.

This software replaces xxgdb or ddd (Data Display Debugger).

โš ๏ธ Automatic detection of 32-bit or 64-bit mode when loading a .asm file

When loading an assembly source file (.asm or .s), PyEzGDB immediately runs the assembler (nasm) and linker (ld or gcc) according to the active architecture. Automatic detection of 32-bit or 64-bit mode is performed out of the box, but you can always manually select the desired mode in the โ€œBits:โ€ dropdown menu in the top toolbar before opening your .asm file.

1
Choose Target Architecture (Bits: 64 or 32) In the top toolbar, select 32 for an x86 program (EAX, ESPโ€ฆ) or 64 for an x86_64 program (RAX, RSPโ€ฆ), or let the application detect the mode automatically.
2
Open a Source File (.asm / .s) Click ๐Ÿ“‚ Open (Ctrl+O). PyEzGDB detects the 32-bit or 64-bit mode, assembles the source with elf32 / -m32 or elf64 / -m64, and generates DWARF debugging symbols (-g).
3
If Changed Afterwards: Ctrl+R If you change the Bits selector after opening a file, press Ctrl+R (File โ†’ Reload / Reassemble) to recompile for the newly selected architecture.
PyEzGDB v1.0.6 โ€” Assembly Debugging Interface (GDB) โ€” exemple.asm (64-bit) ๐Ÿ” Click any image to enlarge
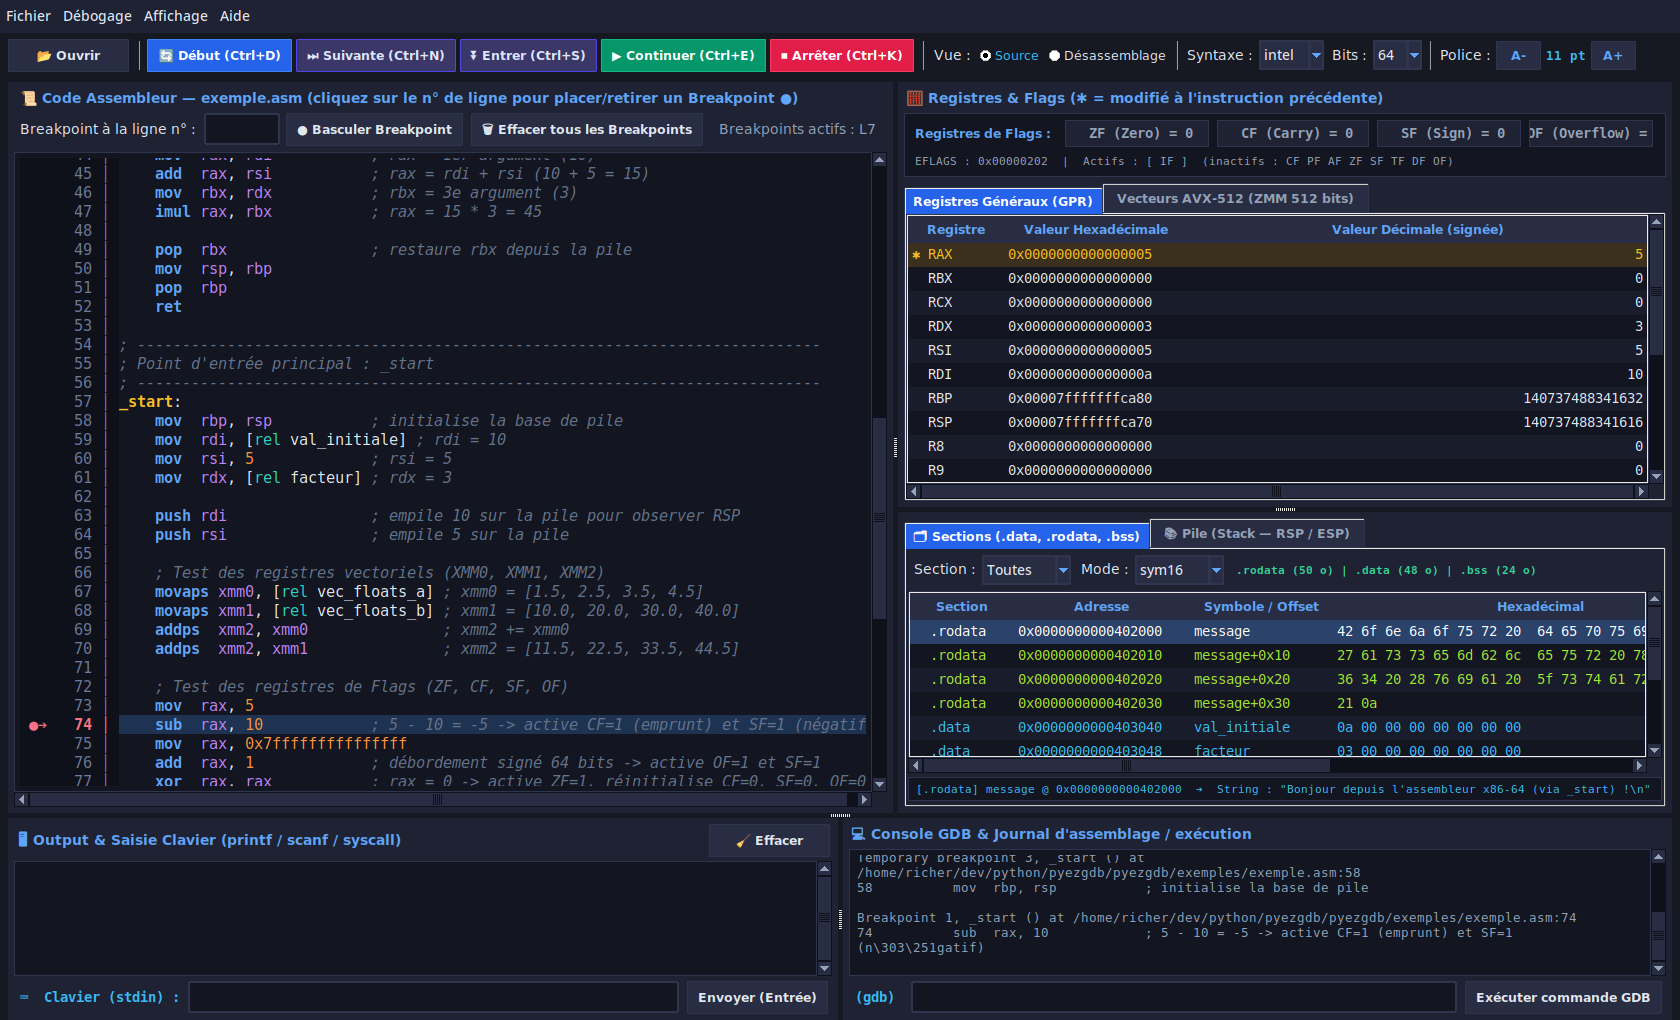
Overview of the PyEzGDB interface in 64-bit mode showing assembly source code, registers, flags, and data sections
General view of PyEzGDB (64-bit mode): NASM source viewer with active breakpoint (โ—) and current instruction pointer (โž” line 74), ZF/CF/SF/OF status flags banner, general-purpose registers (modified โœฑ RAX), .rodata/.data/.bss section inspector, and Output / GDB consoles. Midnight Aurora Theme
x86 / x86_64 Target Architecture

Selecting 32-bit or 64-bit Mode

PyEzGDB supports both 32-bit (i386) and 64-bit (x86_64) assembly programs. Here is how to select the appropriate mode in the toolbar.

๐Ÿ”Ž Close-up of PyEzGDB's Top Toolbar

Locate the Bits : [ 64 | 32 ] dropdown menu just to the right of the syntax selector (intel / att) and right before the font zoom buttons (A- / A+):

PyEzGDB toolbar showing the 32 or 64 Bits selector and the Open button
โ‘  Select โ€œBits : 32โ€ or โ€œBits : 64โ€ FIRST โ‘ก Click โ€œ๐Ÿ“‚ Openโ€ (Ctrl+O) to load the .asm file โ‘ข Start step-by-step execution with โ€œ๐Ÿ”„ Start (Ctrl+D)โ€

32-bit Mode (x86 / IA-32) Bits : 32

  • Automatic NASM assembly: nasm -f elf32 -g -F dwarf file.asm
  • Linking:
    • without C library: _start entry point and ld -m elf_i386
    • with glibc: main entry point and gcc -m32 -no-pie -g
  • Displayed registers: EAX, EBX, ECX, EDX, ESI, EDI, EBP, ESP, EIP, EFLAGS.
  • Stack alignment: 4-byte words (ESP+0x00, ESP+0x04, ESP+0x08โ€ฆ) with stack-based argument passing (push dword).

64-bit Mode (x86_64 / AMD64) Bits : 64

  • Automatic NASM assembly: nasm -f elf64 -g -F dwarf file.asm
  • Linking:
    • without C library: _start entry point and ld -m elf_x86_64
    • with glibc: main entry point and gcc -m64 -no-pie -g
  • Displayed registers: RAX, RBX, RCX, RDX, RSI, RDI, RBP, RSP, R8 to R15, RIP, EFLAGS.
  • Stack alignment: 8-byte quadwords (RSP+0x00, RSP+0x08โ€ฆ) and System V AMD64 ABI calling convention (RDI, RSI, RDX, RCX, R8, R9).
Technical Overview

All Features of PyEzGDB

Designed for higher education, computer architecture lab sessions, and low-level systems programming.

โš™๏ธ

Smart Assembly & Linking

Load your source files directly without writing a complex Makefile: PyEzGDB automatically detects your program's structure.

  • Native support for NASM (.asm), GAS (.s, .S) source files, and pre-compiled ELF executables.
  • Automatic detection of the entry point (_start or main) and external symbols (extern printf, scanfโ€ฆ).
  • Automatic compilation with DWARF debug symbols (-g -F dwarf) to map every machine instruction back to its exact source line.
๐Ÿ“œ

Visual Code Viewer & Breakpoints

Inspect your assembly code with rich syntax highlighting and fine-grained breakpoint management.

  • Dedicated syntax highlighting: general and SIMD instructions, registers, directives, labels, constants, and comments.
  • Instant toggle between Source View (.asm) and GDB Disassembly View (intel or att syntax).
  • Add or remove Breakpoints (โ—) with a single click on the line number, a double-click on the instruction, or by typing a line number.
  • Real-time tracking of the RIP / EIP instruction pointer via the emerald arrow โž”.
๐Ÿงฎ

General-Purpose Registers (GPR) & EFLAGS

Observe the exact effect of every arithmetic, bitwise, or branching instruction on the processor state.

  • Dedicated Flags Banner: 4 real-time visual badges for ZF (Zero), CF (Carry), SF (Sign), and OF (Overflow) + full EFLAGS breakdown.
  • Simultaneous dual display of every register in both hexadecimal and signed decimal.
  • Golden-amber highlighting (โœฑ) for all registers and flags modified by the last executed instruction.
โšก

SIMD Vector Registers (SSE / AVX / AVX-512)

Inspect parallel floating-point and integer computations on modern x86 architectures without tedious GDB commands.

  • Automatic host CPU hardware detection: SSE (XMM0..15, 128-bit), AVX/AVX2 (YMM0..15, 256-bit), or AVX-512 (ZMM0..31, 512-bit).
  • Instant on-the-fly conversion to float (32-bit IEEE 754), double (64-bit), int32, int64, hex32, or hex64.
  • Activity counter [โœฑN] on the tab header whenever vector registers change value.
๐Ÿ—‚๏ธ

Memory Sections (.data, .rodata, .bss) & Stack

Explore your global variables, strings, and the live evolution of the call stack frame.

  • Sections Tab: hexadecimal dump and ASCII/UTF-8 decoding with symbol resolution, section filtering, and 3 display modes (sym16, symbol, hex16).
  • Stack Tab: descending-address layout anchored to the initial stack base; the โ† RSP / โ† ESP pointer visually moves down on a push and back up on a pop.
๐Ÿ–ฅ๏ธ

Output / Stdin Terminal (PTY) & GDB Console

Interact with your assembly program's standard input and output just like in a native terminal.

  • Dedicated pseudo-terminal (PTY) preloaded with libstdbuf.so: even a printf without a trailing \n is flushed immediately after call printf.
  • Interactive keyboard input (stdin): full support for scanf and the sys_read syscall with a visual indicator when waiting for input.
  • Integrated GDB Console: run any standard GDB command (x/16gx $rsp, print $rax) with automatic resynchronization of all visual panels.
Visual Guided Tour

The PyEzGDB Interface in Action

Explore the environment's panels through real 32-bit and 64-bit debugging sessions.

32-bit Session (i386) & Standard I/O

32-bit Debugging, ESP / EBP Stack, and scanf Keyboard Input

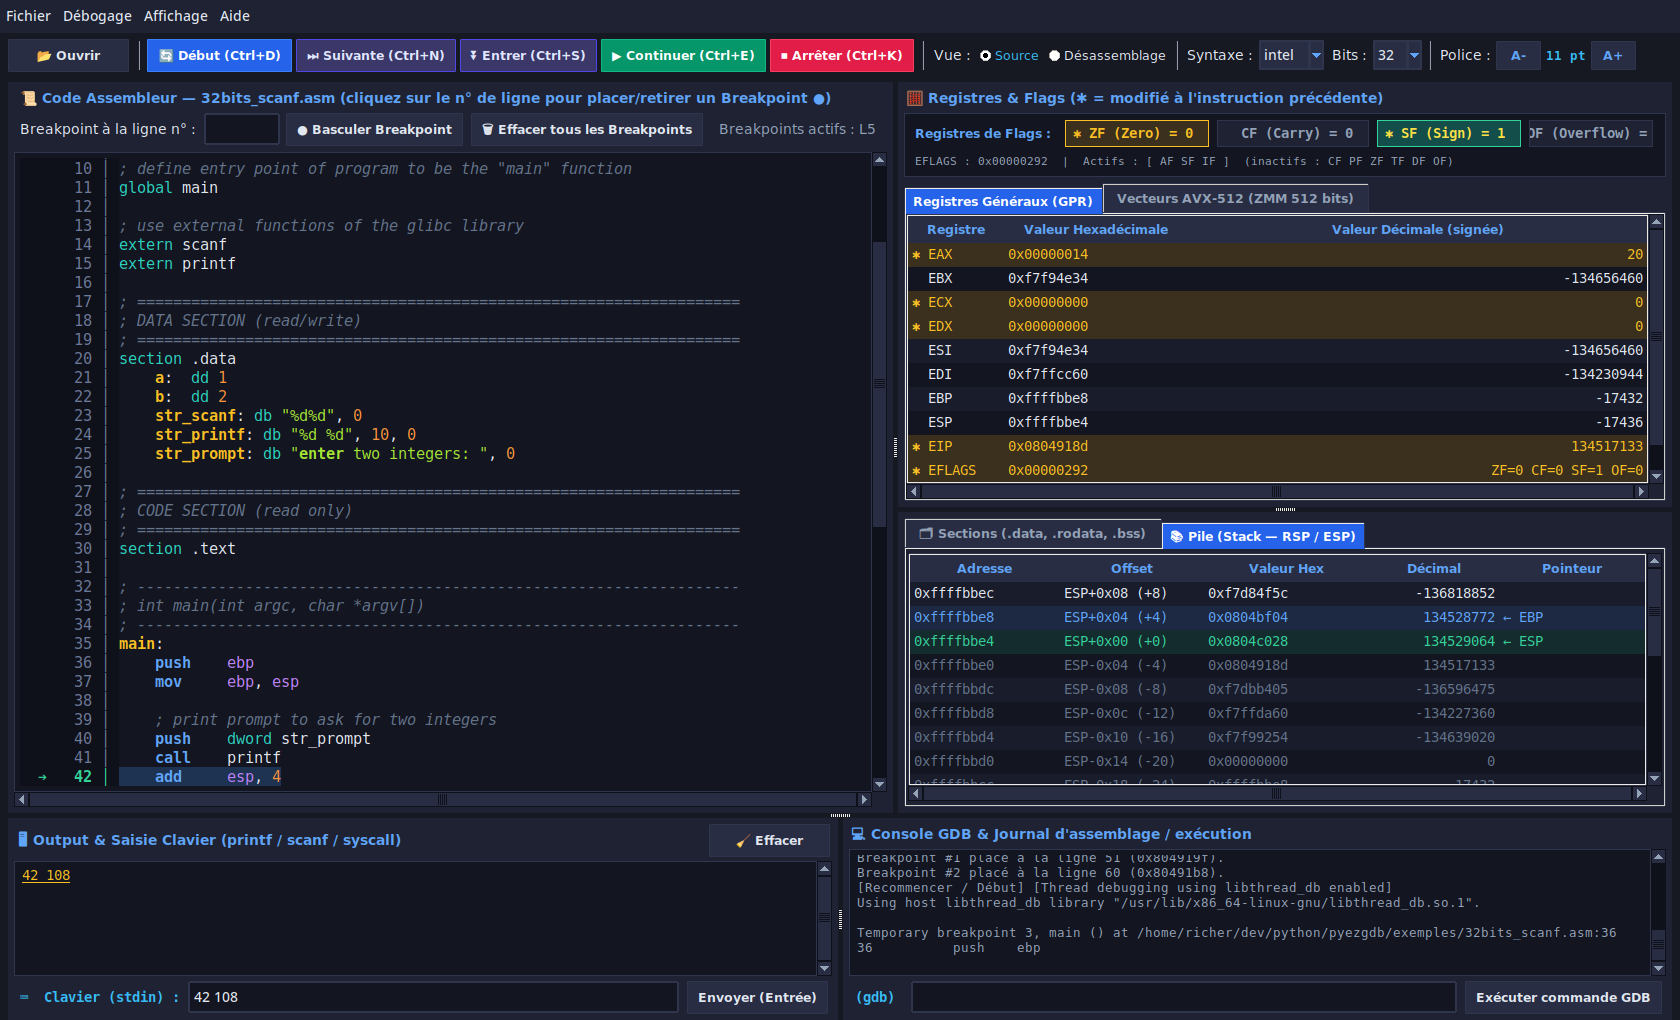
After selecting Bits : 32 in the toolbar and loading 32bits_scanf.asm, PyEzGDB automatically adapts every panel to the 32-bit architecture:

  • General-purpose registers switch to 32-bit mode (EAX, EBX, ECX, EDX, ESI, EDI, EBP, ESP, EIP).
  • The Stack tab displays 4-byte words (ESP+0x00, ESP+0x04โ€ฆ) and highlights both โ† ESP and โ† EBP pointers.
  • The bottom โŒจ๏ธ Keyboard (stdin) bar lets you pre-fill or send on-the-fly values read by call scanf (here 42 108).
Bits : 32 nasm -f elf32 gcc -m32 -no-pie ESP / EBP printf & scanf
32bits_scanf.asm โ€” 32-bit Mode + ESP/EBP Stack + Keyboard (stdin) ๐Ÿ” Enlarge
Debugging a 32-bit assembly program with scanf and ESP/EBP stack visualization
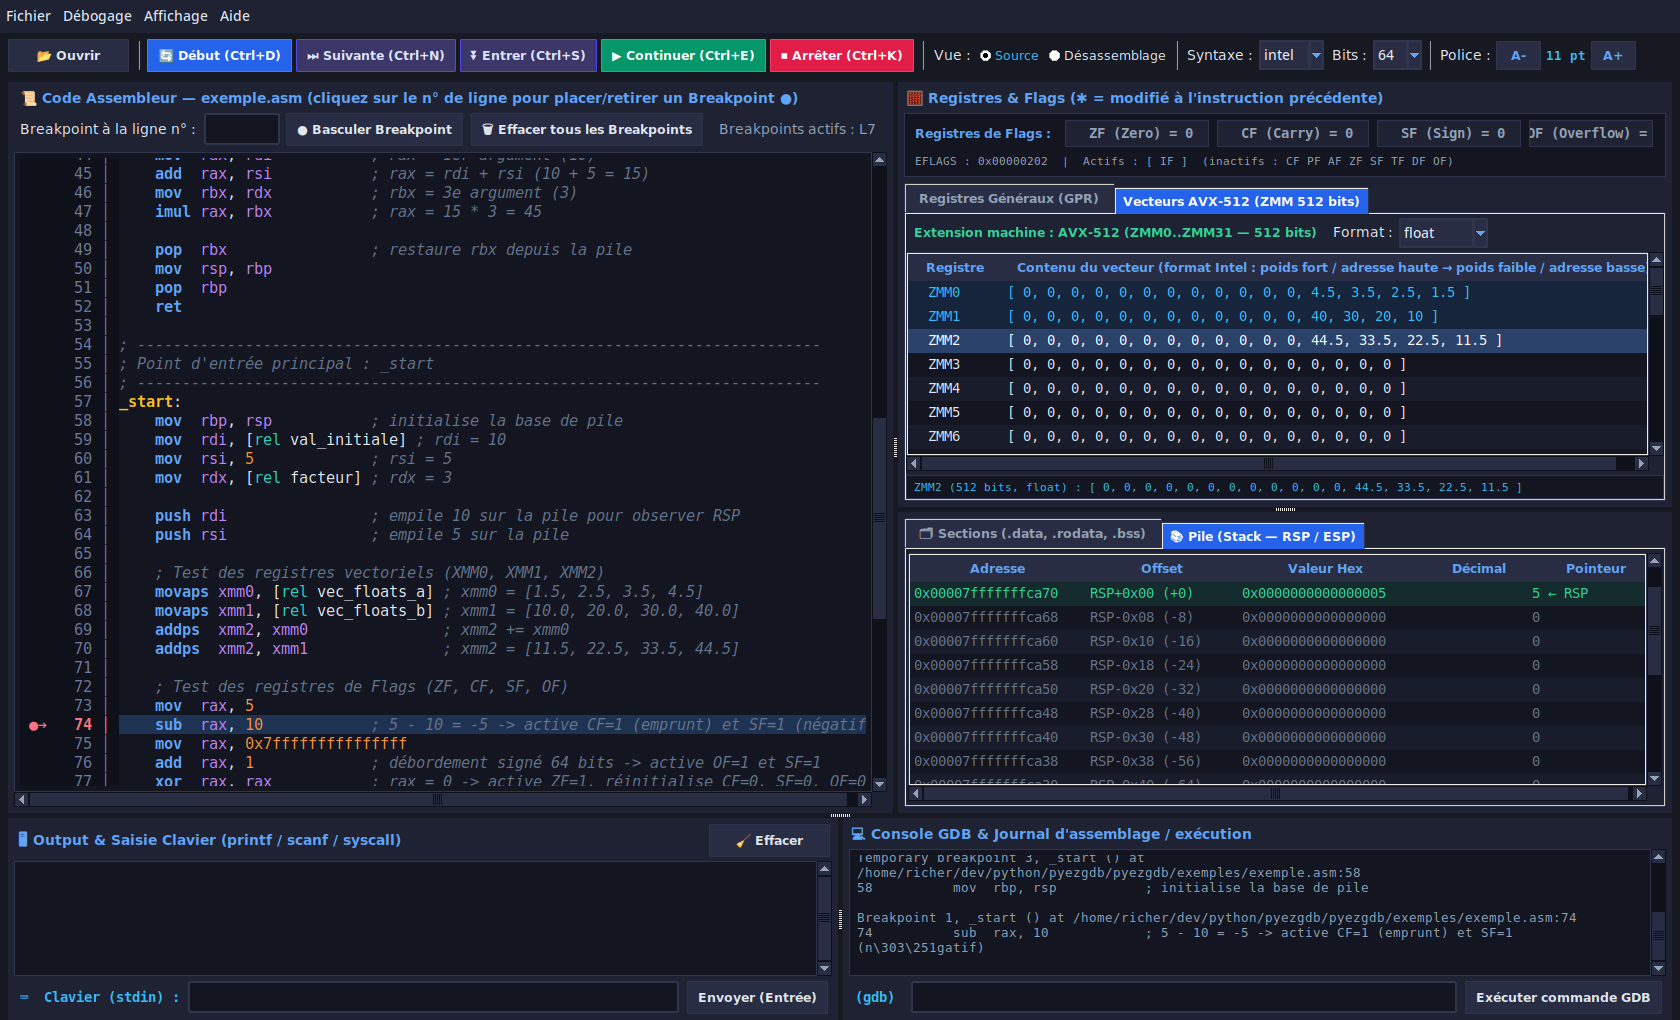
SIMD Vector Inspector (float format) & 64-bit Stack (RSP) ๐Ÿ” Enlarge
Inspecting SIMD vector registers in float format alongside the 64-bit RSP stack
Vector Computing & Stack Frame

SIMD Inspector (XMM / YMM / ZMM) and Downward-Growing Stack

When stepping through vector instructions such as movaps or addps, switch to the SIMD Vectors tab and choose the interpretation format (float, double, int32, hex64โ€ฆ):

  • Immediate view of floating-point lanes: XMM0 = [4.5, 3.5, 2.5, 1.5], XMM1 = [40, 30, 20, 10], and their sum XMM2 = [44.5, 33.5, 22.5, 11.5].
  • Dedicated bottom detail bar displaying all lanes of the currently selected vector register.
  • Below, the Stack (RSP / ESP) tab shows the values pushed by push rdi (10) and push rsi (5 โ† RSP).
SSE / AVX / AVX-512 Format: float / double push / pop โ† RSP / โ† RBP
Low-Level View & Program Output

GDB Disassembly View, .bss Section, and Output Terminal

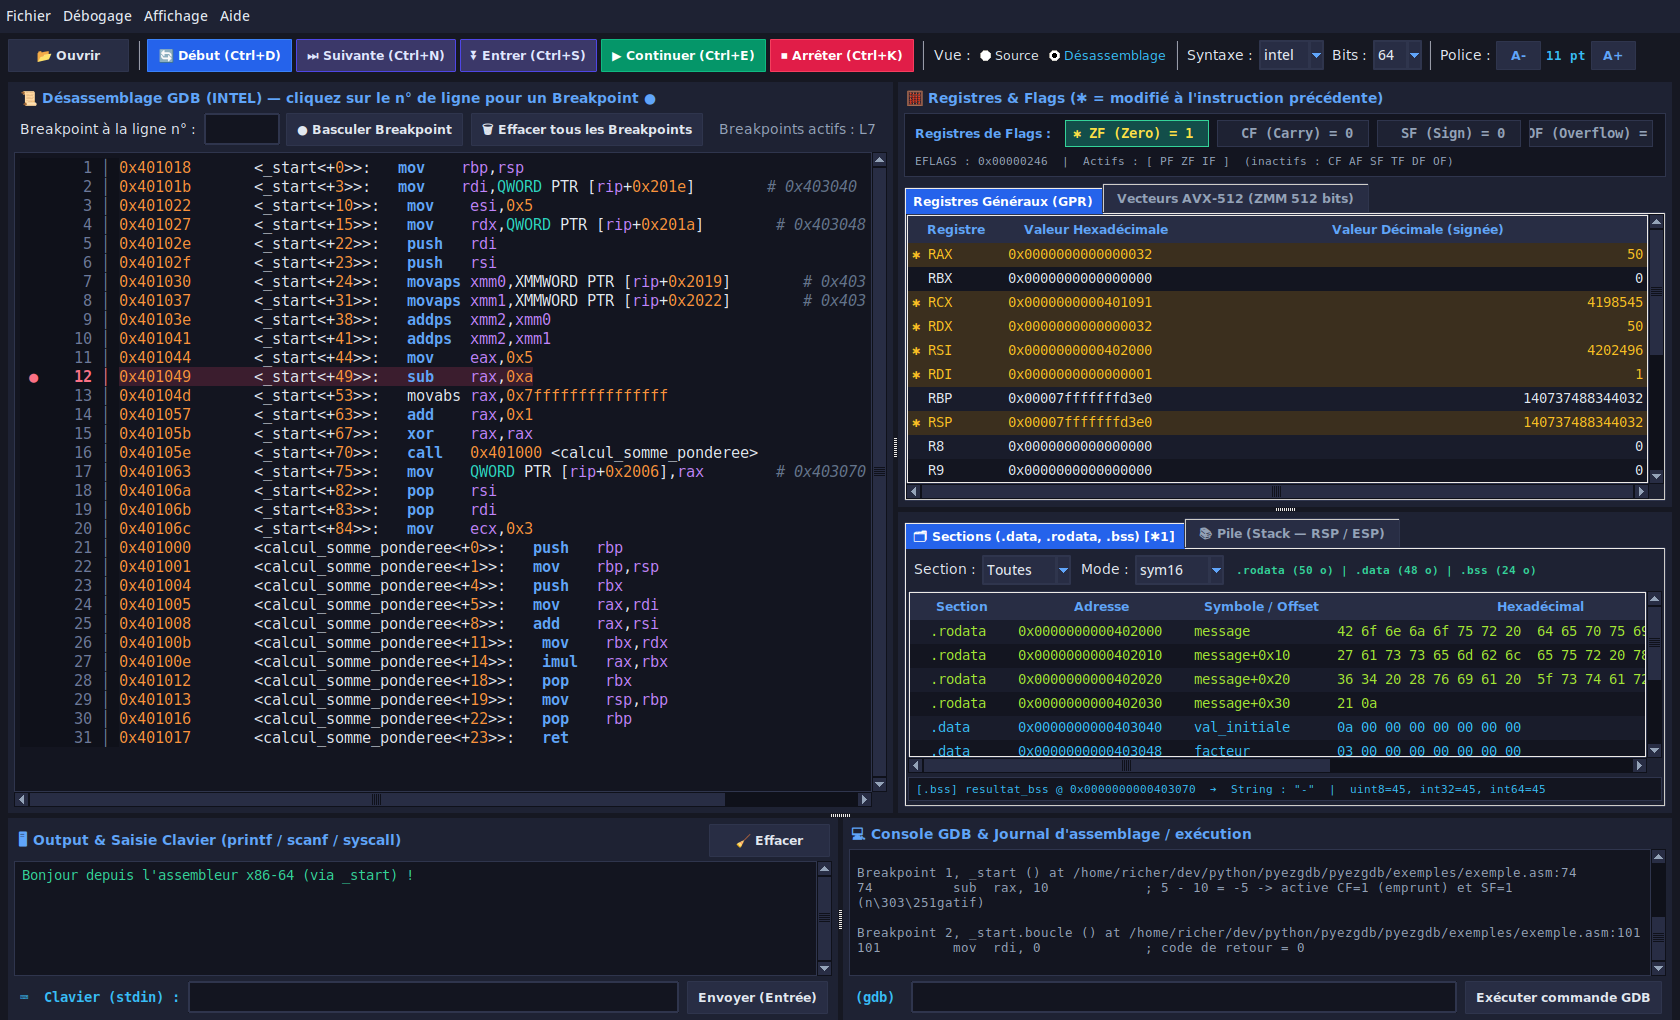
With a single click on the View: Disassembly radio button, compare your source code against the actual machine instructions assembled in memory by NASM/GCC:

  • Displays hexadecimal addresses (0x401018โ€ฆ), symbol-relative offsets (<_start+75>, <calcul_somme_ponderee+0>), and RIP-relative addressing annotations.
  • Real-time memory-write detection: the Sections (.data, .rodata, .bss) [โœฑ1] tab highlights that variable resultat_bss has just been updated to 45 (0x2d).
  • The ๐Ÿ–ฅ๏ธ Output panel displays the text written by the syscall instruction (sys_write).
Intel / AT&T Syntax RIP-relative Addresses .bss [โœฑ1] PTY Output
GDB Disassembly View (Intel) + .bss Update + syscall Output ๐Ÿ” Enlarge
GDB Disassembly View showing the modified .bss section and program output in the Output panel
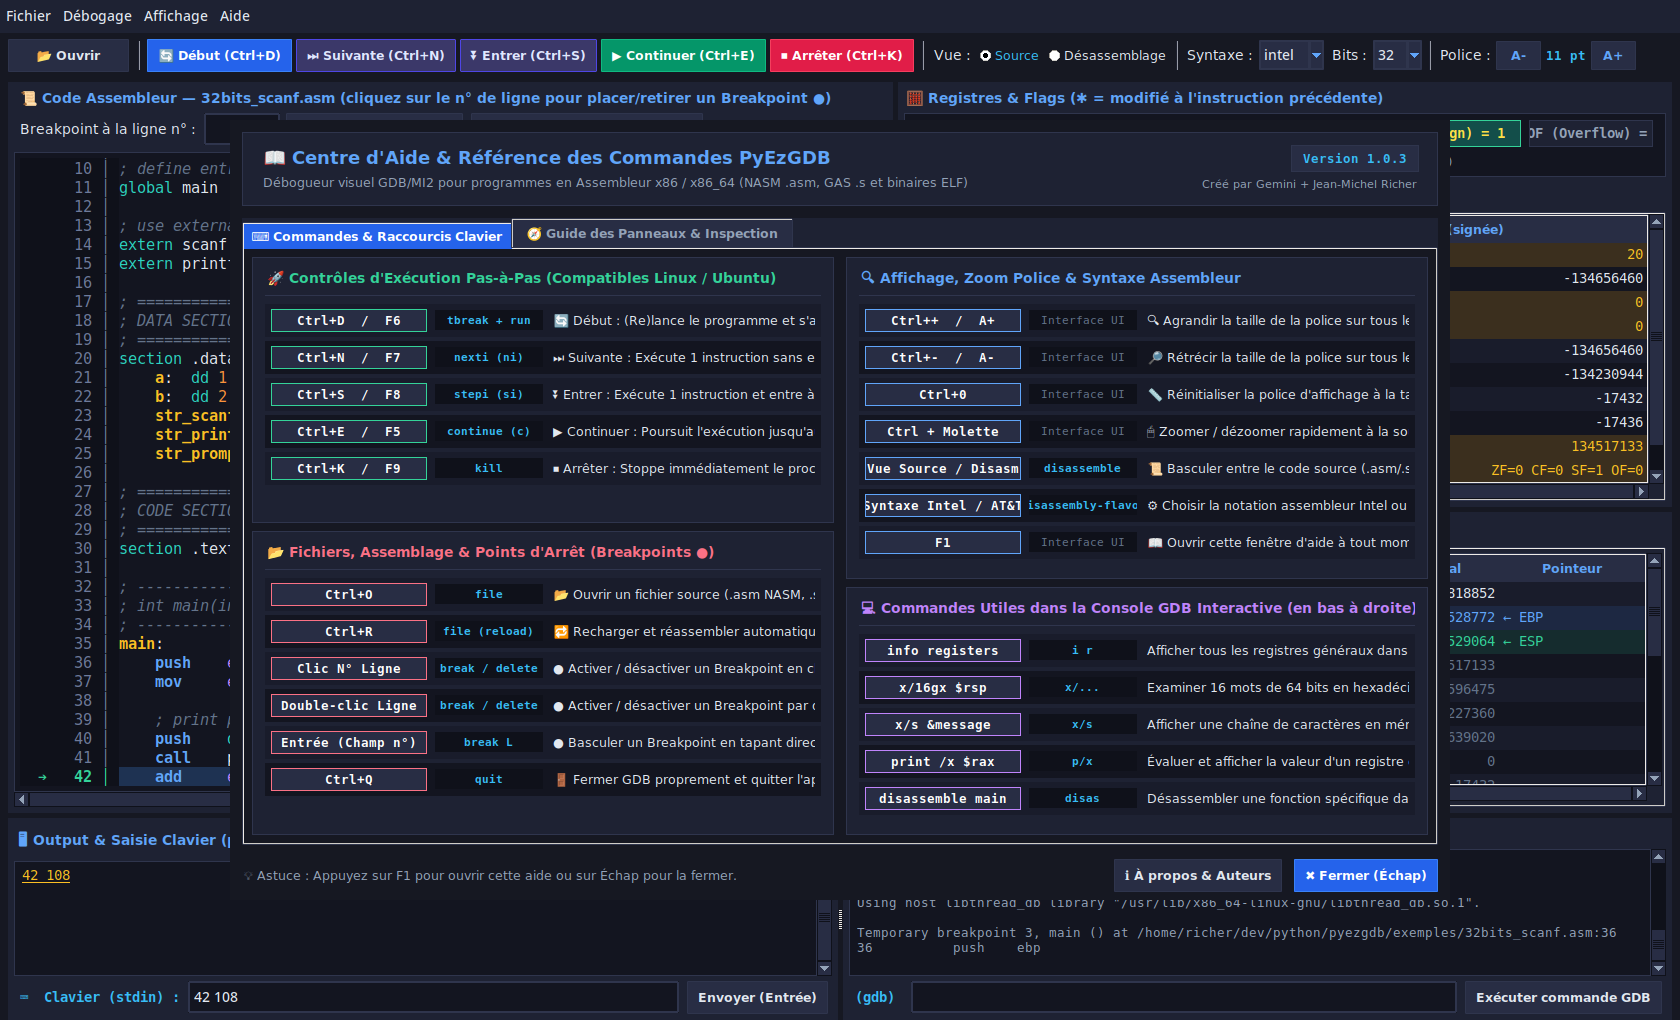
Built-in Help Center & Command Reference (F1 Key) ๐Ÿ” Enlarge
PyEzGDB built-in help dialog accessible via the F1 key
Usability & Self-Reliance

Built-in Help Center (F1) & Font Zoom (A- / A+)

Tailored both for students working independently in lab sessions and for instructors projecting code in lecture halls:

  • Context-sensitive Help (F1): summarizes all keyboard shortcuts, their native GDB equivalents (tbreak + run, nexti, stepi, x/16gx $rspโ€ฆ), and a detailed guide to every panel.
  • Instant Global Zoom (A- / A+): simultaneously scales the font size (from 8 pt to 24 pt) across the source view, register tables, stack, and consoles via Ctrl++, Ctrl+-, or Ctrl + Mouse Wheel.
Step-by-Step Control

Execution Controls & Keyboard Shortcuts

All 5 primary execution commands feature dual shortcuts (Ctrl+โ€ฆ and function keys F5 through F9) specifically chosen to avoid any conflict with Linux / Ubuntu desktop shortcuts (such as F10).

๐Ÿ”„ Start (Ctrl+D)
Ctrl+D or F6

Sets a temporary breakpoint on _start or main, (re)starts the program, and pauses on the 1st instruction.

โญ Next (Ctrl+N)
Ctrl+N or F7 โ€” nexti

Executes one assembly instruction without stepping into subroutines invoked via call (Step Over).

โฌ Step Into (Ctrl+S)
Ctrl+S or F8 โ€” stepi

Executes one assembly instruction and steps inside functions invoked via call (Step Into).

โ–ถ Continue (Ctrl+E)
Ctrl+E or F5 โ€” continue

Resumes normal execution until the next breakpoint (โ—), a keyboard input prompt, or program termination.

โน Stop (Ctrl+K)
Ctrl+K or F9 โ€” kill

Immediately terminates the debugged process and resets the execution state.

Keyboard / Mouse Shortcut Button / Action in PyEzGDB Equivalent GDB Command
Bits : 32 / 64 Selector โš ๏ธ Select BEFORE opening a .asm file to set the target assembly architecture (32-bit or 64-bit) nasm -f elf32/elf64 + gcc -m32/-m64
Ctrl+O ๐Ÿ“‚ Open a source file (.asm, .s) or an ELF binary file <executable>
Ctrl+R ๐Ÿ” Reload and reassemble the current file (applying the active Bits selector) file <executable>
Ctrl+D or F6 ๐Ÿ”„ Restart from the beginning (pause at _start or main) tbreak _start/main + run
Ctrl+N or F7 โญ Next instruction without entering call subroutines (Step Over) nexti (ni)
Ctrl+S or F8 โฌ Execute instruction and step into a call subroutine (Step Into) stepi (si)
Ctrl+E or F5 โ–ถ Continue execution until the next breakpoint continue (c)
Ctrl+K or F9 โน Immediately stop the debugged program kill
Click Line # or Double-click โ— Toggle a breakpoint on the corresponding line break / delete
Ctrl++ / Ctrl+Wheel Up ๐Ÿ” Increase display font size across all panels (A+ button, up to 24 pt) โ€”
Ctrl+- / Ctrl+Wheel Down ๐Ÿ”Ž Decrease display font size across all panels (A- button, down to 8 pt) โ€”
Ctrl+0 ๐Ÿ“ Reset font size to its default value (11 pt) โ€”
F1 ๐Ÿ“– Open the built-in Help Center & Command Reference help
Ctrl+Q ๐Ÿšช Cleanly close GDB and quit PyEzGDB quit
Getting Started & Integration

Installation, CLI Launch, and Python API

Install pyezgdb in seconds on Linux (Debian, Ubuntu, Mint, Fedora, Arch) and use it either via its graphical interface or programmatically from your Python scripts.

1. System Prerequisites & Installation (Debian / Ubuntu) bash
# Install system tools (include gcc-multilib for 32-bit mode support)
sudo apt update
sudo apt install python3 python3-tk python3-pip gdb nasm binutils gcc gcc-multilib
# Create a Python virtual environment
python3 -m venv ~/venvasm
# Activate the virtual environment
source ~/venvasm/bin/activate
# Download the .whl package
(venvasm) wget https://leria-info.univ-angers.fr/~jeanmichel.richer/pub/pyezgdb-1.0.6-py3-none-any.whl
# Install the PyEzGDB package from the .whl file
(venvasm) pip install pyezgdb-1.0.6-py3-none-any.whl
# Launch the graphical interface
(venvasm) pyezgdb
2. Programmatic Control via GDBController python
from pyezgdb import GDBController

ctrl = GDBController()
# Specify preferred_arch_bits=32 or 64 when loading a .asm file
ok, log = ctrl.load_target("examples/32bits_simple_example.asm", preferred_arch_bits=32)
if ok:
    ctrl.toggle_breakpoint_source_line(59)
    ctrl.start_or_restart()
    ctrl.continue_execution()
    print("EAX =", hex(ctrl.registers.get("eax", 0)))
    print("Flags =", ctrl.get_main_flags())
    print("Output:", ctrl.drain_program_output())
ctrl.cleanup()